 MicroPhysics
Two-Color
Interferometry for the Measurement of Head/Tape Spacing
MICROPHYSICS,
INC.
Abstract:
The
apparatus and theory used to interferometrically measure head/tape spacing are
described. The interferometric
technique requires the use of either a transparent head or transparent tape.
A measurement of average spacing vs. tape speed illustrates the ability
to measure variations in spacing on the order of one or
two nanometers. In addition, an
experiment is documented in which a clear head is used in conjunction with
clear tape. Spacing
measurements were made both through the glass head and through the clear tape.
The results agreed to within expected variations which were caused by the
surface roughness of the clear tape. A
measurement of head/tape spacing on a real thin-film magnetic head is
illustrated which shows an increase in head/tape spacing over the pole tip
region due to pole tip recession.
Introduction:
With the current increase in tape
recording density, control and understanding of head/tape spacing is becoming
more critical for acceptable tape head performance.
Although much head development has been done by a simple visual
inspection of white light interference fringes at the head/tape interface,
scientific methods exist today which can be used to accurately quantify
head/tape spacing. This paper
describes an interferometric method which can measure head/tape spacing with
sub-microinch (nanometer) resolution.
Measurement
Apparatus:
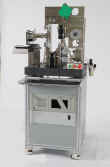
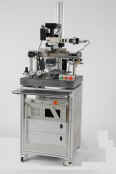
To measure spacing
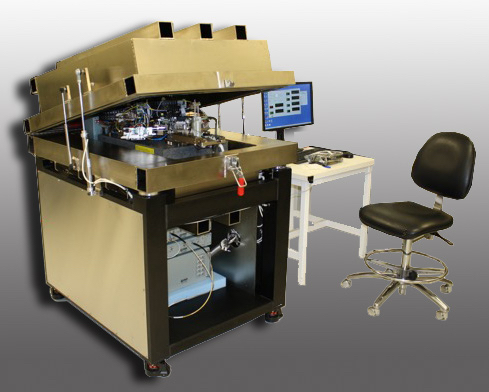
interferometrically either the head or tape must be transparent. Figure 1
illustrates the configuration with a transparent head.
Figure
1
:
Two-Color Interferometer Apparatus
The
system controller synchronizes the stroboscopic illumination and the digital
camera read out with the magnetic tape loop position.
Light leaves the strobe and is directed to the head/tape interface using
a beam splitter. Multiple
reflections occur at and between the head and tape surface.
The light then goes back through the first beam splitter to a second beam
splitter that directs light toward two digital CCD cameras.
Interference filters of a 10 nm bandwidth are used to produce two
distinct wavelengths: one color for each camera. The system controller processes the intensity information
from each camera and feeds the data to the host computer for analysis using
multi-beam interferometric theory with corrections for phase shift on
reflection. Head/tape spacing can
also be measured using real heads in conjunction with transparent tape.
When using real heads, the heads are mounted below the tape rather than
above it as shown in Figure 1.
Interferometric
Theory:
Head/Tape spacing is
calculated using multi-beam interferometric theory (Equation 1)[1].
 (
1
)
(
1
)
In Equation 1,
r is the amplitude of the external reflection off the lower surface, s is the
amplitude of the internal reflection off the upper surface, and
is the phase shift between the two reflected wave fronts.
 (
2
)
(
2
)
In Equation (2),
h is the head/tape spacing,
is the wavelength of the light, and
is the combined phase shift due to reflection off the surfaces [1].
The values of r, s, and
are typically determined by ellipsometric measurement of the surfaces using
light of the same wavelengths as those being used for the interference
measurements of spacing [2,
3, 4,
5].
When the spacing is determined
by application of Equations 1
and 2, the spacing can be determined
independently by each color. Due to
system imperfections, the spacing measurements determined by each color can be
different. If the difference
between the two measurements is greater than a pre-specified tolerance, the
spacing measurement is rejected, otherwise, a degree of confidence is assigned
to the measurement.
Measurement
Data:
A typical interference
image is illustrated in Figure 2.
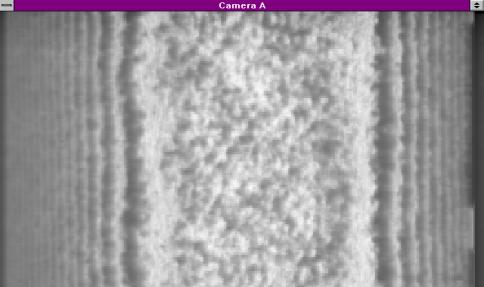
Figure
2
: Interference Fringes at the Head/Tape Interface
The data
for Figure 2
was taken using a tape from a standard QIC cartridge together with a simple
cylindrical glass head contour with a 3.175 mm (0.125 inch) radius. Tape
tension was 8.9 gmf/mm (2.0 oz/0.25 in). The tape wrap was 3 degrees per side,
and the tape speed was 0.127 m/s (5.0 in/sec).
The corresponding spacing for this intensity is shown in Figure 3.
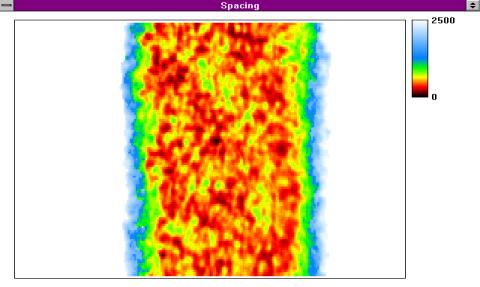
Figure
3
: Head/Tape Spacing Contour Map, Spacing in Angstroms
The spacing shown in
Figure 3 is quite variable due to the surface
roughness of the standard QIC tape. In
order to get an average spacing, some averaging was done. Figure 3
is composed of an array of 266 X 118 spacing measurements.
The measurement area is 718 x 318 microns.
In order to plot average spacing along the tape machine direction, the
spacing was averaged for rows numbered 20 through 99.
Figure 4 illustrates the spacing along the tape machine direction at four
different tape speeds.
Figure
4: Head/Tape Spacing Measurement
Through Glass Head Using QIC Tape
Figure
5: Average Head/Tape Spacing vs.
Tape Speed, QIC Tape on a Glass Head
In order to verify
measurement capability using clear tape, measurements were made using clear tape
on the 3.175 mm radius glass head. The
“clear tape” used in this experiment was actually ordinary magnetic tape
which had a small window of the front and back coating removed using solvents.
The spacing measurement equipment was synchronized so that the
measurement was made at the instant that the clear window was over the head.
Figure 6 shows head/tape spacing measurements with a tape tension of 8.9
gmf/mm (2.0 oz/0.25 in). The
tape wrap was 3 degrees per side. All
conditions are similar to those used for the data in Figure 4 except that
different tape is used. The
different tape makes a significant difference in the head/tape spacing behavior.
At lower speeds, the minimum spacing is larger because the surface
roughness of the clear tape is larger than the surface roughness of the QIC
tape. At higher speeds, the clear
tape exhibits much larger spacing than the QIC tape due to air bearing effects.
The air bearing effect is larger for the clear tape because it is more
flexible and therefore has a larger air bearing area than the stiffer tape.
The larger air bearing area causes an increased air bearing effect which
in turn increases head/tape spacing.
Figure
6: Head/Tape Spacing Measurement
Through Clear Tape on Glass Head.
In order to verify that
measurement through clear tape was virtually identical to measurement through a
clear head, a similar measurement was made through the glass head using clear
tape. Using the same parameters as used for the data in Figure 6,
Figure 7 illustrates the head/tape spacing with the measurement through the
glass head.
Figure
7: Head/Tape Spacing Measurement
Through Glass Head on Clear Tape
The measurements shown in
Figures 6 and 7 are very similar. The
major cause of difference between the measurements is that different positions
of the clear tape were used. These
different positions had different surface roughness characteristics and
therefore, resulted in somewhat different spacing measurements.
Figure 8 illustrates the use
of clear tape on a real magnetic head. Higher
magnification optics are used to resolve the thin film pole tips.
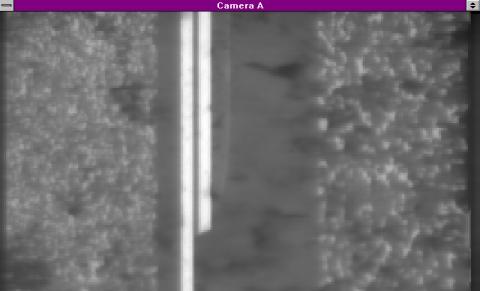
Figure
8: Interference Image using Clear Tape on a Thin Film Head
The average spacing in the
machine direction is plotted in Figure 9. The
spacing is clearly increased by approximately 30 nm at the region of the pole
tips.
Figure
9: Head/Tape Spacing Showing an Increase of Approximately 30 nm Caused by Pole
Tip Recession
Summary
and Comment:
The combination of
scientific-grade CCD cameras, strobe illumination, two colors and multi-beam
theory provides head/tape spacing measurements which are superior to those
previously reported. Figure 5
illustrates that average spacing changes on the order of one or two nanometers
can be resolved using this equipment.
Figures 6 and 7 indicate that
the measurement technique is virtually identical for both through transparent
head and through transparent tape applications.
Although the measurement technique is virtually identical, the
substitution of transparent tape for magnetic tape can cause significant
variations in head/tape spacing behavior if the substitutive tape has different
mechanical properties. Figures 4
and 5 illustrate that substitution of transparent tape with different roughness
and stiffness properties causes significant variations in the head/tape
behavior.
References
[
1
] Anders, Thin Films in Optics, The Focal Press, London, 1965.
[
2
] Lacey, C., Shelor, R., Cormier, A. J. and Talke, F. E., “Interferometric
Measurement of Disk/Slider Spacing: the Effect of Phase Shift on Reflection,”
IEEE Transactions on Magnetics, Proceedings of the InterMag, September/October
1993.
[
3
] Lacey, C. and Talke, F.E., “Measurement and Simulation of Partial Contact at
the Head/Tape Interface,” Transactions of the ASME Journal of Tribology, Vol.
114, p.646, October, 1992.
[
4
]Muranushi, F., Tanaka, K., and Takeuchi, Y., “Estimation of the Zero Spacing
Error Due to a Phase Shift of Reflected Light in Measuring a Magnetic Head
Slider’s Flying Height by Light Interference,” Adv. Info. Storage Syst.,
Vol. 4, p. 371, 1992.
[
5
]
Born, M. and Wolf, E., Principles of
Optics, Pergamon Press, Oxford, 1989.
Specifications subject
to change without notice or obligation.
Copyright © 1999-2020 MicroPhysics, Inc. All Rights Reserved.